Unlock Training Insights with OLP Dashboards
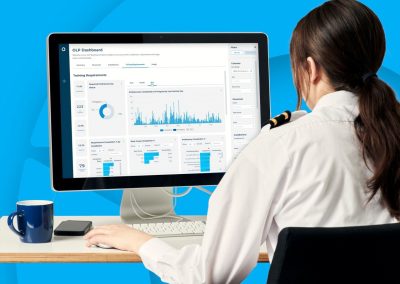
The online version of the Ocean Learning Platform (OLP) now has a powerful interactive dashboard feature designed to give training managers actionable insights into learning performance without the need to be data experts.
This blog highlights the core functionalities of these dashboards, offering practical ways to maximise their utility. The full webinar recording below offers a deeper dive into the features.
Why Learning Dashboards Matter
Understanding how your team engages with training is critical to improving outcomes. With the new dashboards, Training Managers and stakeholders in the wider business have a powerful tool to:
- Track Learning Engagement: Monitor crew activity, training progress, and time spent on learning activities.
- Ensure Compliance: Visualise mandated training completion rates at individual, vessel, or fleet levels.
- Drive Actionable Insights: Quickly filter data to identify trends, gaps, or specific action points.
Key Features of the OLP Dashboards
What the Dashboards provide:
Enhanced Filtering and Cross-Visual Interaction
-
- Cross-visual filtering allows detailed insights—for example, isolating learning engagement for specific vessels.
- Slice and dice data by key attributes such as vessel type, date range, or crew role.
Drill-Down Capabilities
-
- Track specific crew members’ progress or review vessel-wide performance.
- Navigate from high-level summaries to individual records for a clear lineage of data points.
Data Download Options
-
- Export data in CSV, Excel, or image formats for further analysis or presentations.
Integration across platforms
-
- The dashboards fit seamlessly into your existing online OLP interface without additional logins.
How this helps: Real-Life Use Cases
- Measuring Learning Engagement
Managers can quickly analyse metrics such as the number of unique learners, total completed activities, and time spent on training. For instance, filter data to showcase group learning trends over the last 12 months and communicate these insights effectively with stakeholders.
- Monitoring Compliance and Current Status
View completion rates for mandatory training initiatives by vessel and rank. Granular details, such as which crew members have pending courses, help focus follow-ups for better compliance.
- Assessing Installation Status
Ensure vessels are running the latest software and synchronising data regularly by checking installation status directly within the dashboard.
Empowering Data-Driven Decisions
The OLP dashboards are designed to simplify your workflow, allowing you to act on insights with ease and these tools help align learning outcomes with broader operational goals.
What’s Next?
This release marks the beginning of a comprehensive suite of maritime data-driven solutions from Ocean Technologies Group. Future updates include more dashboards across Learn, Crew and Fleet products, analytics APIs, and predictive features using AI and ML, aiming to deepen your understanding of learning needs and effectiveness.
Learn more about the OTG data strategy here

Want to be first to hear all our news?
Subscribe to our Newsletter to keep up to date!


